On a story posted at 6:04 am on Friday morning, the Washington Post said, “The consensus forecast of economists surveyed by Bloomberg is that GDP rose at a 1.8 percent annual rate in the second quarter [from april to June], about the same as the 1.9 percent rate of growth in the first quarter [from January to March].” Washington Post
 |
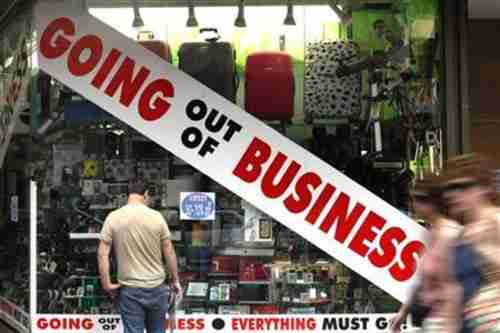
| On the streets of New York (Reuters) |
The Commerce Department released th GDP figures at 8:30 am on Friday, and they were stunningly worse than economists predicted, according to Reuters:
- The GDP growth figure for Q2 (April-June) was 1.3%, much lower than the expected 1.9%.
- The GDP growth figure for Q1 (January-March) was revised down to 0.4%, much lower than the previously reported 1.9%.
- The GDP growth figure for Q4 (Oct-Dec of last year) was revised down to 2.3%, lower than the previously reported 3.1%.
Gee, you think? This is like a weather forecaster who looks out the window and predicts that it’s raining.
The reference to the “debt ceiling nonsense” is irrelevant. These figures have been plummeting since the end of last year, long before the debt ceiling became an issue.
Here’s some commentary from the Consumer Metrics Institute (PDF):
“July 29, 2011: BEA Reports 1Q-2011 and “Great Recession” Far Worse Than We Were Previously Told
Included in the BEA’s first (“Advance”) estimate of second quarter 2011 GDP were significant downward revisions to previously published data, some of it dating back to 2003. Astonishingly, the BEA even substantially cut their annualized GDP growth rate for the quarter that they “finalized” just 35 days ago — from an already disappointing 1.92% to only 0.36%, lopping over 81% off of the month-old published growth rate before the ink had completely dried on the “final” in their headline number. And as bad as the reduced 0.36% total annualized GDP growth was, the “Real Final Sales of Domestic Product” for the first quarter of 2011 was even lower, at a microscopic 0.04%.
And the revisions to the worst quarters of the “Great Recession” were even more depressing, with 4Q-2008 pushed down an additional 2.12% to an annualized “growth” rate of -8.90%.
The first quarter of 2009 was similarly downgraded, dropping another 1.78% to a devilishly low -6.66% “growth” rate. And the cumulative decline from 4Q-2007 “peak” to 2Q-2009 “trough” in real GDP was revised downward nearly 50 basis points to -5.14%, now officially over halfway to the technical definition of a full fledged depression.
One of the consequences of the above revisions to history is that the BEA headline “Advance” estimate of second quarter GDP annualized growth rate (1.29%) is magically some 0.93% higher than the freshly re-minted growth rate for the first quarter. From a headline perspective, that makes for a far better report than the 0.63% drop from the previously published 1Q-2011 number — since otherwise the new 2Q-2011 numbers would be showing an ongoing weakening of the economy.”Note that today’s report has downward revisions going back several years. Economists had been talking about an improving economy this whole time, while people were losing their jobs and homes and wondering what the economists were talking about. Now, with all these downward revisions, we can see that the people were right and the economists were wrong.
I keep saying this, because it’s important: Economists have NO IDEA what’s going on.
I mean, this is really amazing. The economists in Washington produced figures for Q1 that were WILDLY more optimistic than they turned out to be, and they’ve been overly optimistic for YEARS. It’s quite possible that the most recent figure of 1.3% is also wildly optimistic.
Macroeconomics models are completely static in time, and economists assume that the same macroeconomics model that worked in the 70s and 80s also work today, an assumption which is completely absurd on its face. As I’ve pointed out many times, economists have been consistently wrong about everything, at least since 1995. They didn’t predict and can’t explain the 1990s tech bubble, the real estate and credit bubbles, the financial crisis since 2007, where we are today, and what’s coming next year.
Their predictions are no better than flipping a coin. In fact, since they’ve been predicting each month for several years that real estate prices had reached a bottom and that a V-shaped recovery would begin the next quarter, their predictions are MUCH WORSE than flipping a coin.
Generational Dynamics is to macroeconomics as macroeconomics is to microeconomics. Macroeconomics models aggregate microeconomics models over the entire population, and Generational Dynamics models aggregate macroeconomic models over time.
In brief: The 1990s tech bubble began when the generations of Great Depression survivors retired, all at once. The credit bubble began when Gen-Xers began moving into middle management positions. And today, the current generations of people have been burned and have become extremely risk averse, and will remain risk averse for the rest of their lives. There will not be any recovery until the 2020s.
Mainstream economists have no idea what they’re talking about. Anyone who listens to them is going to get screwed.
Europe’s economy continues to deteriorate
 |
| Italy 2 year bonds – 7/29/2011 – 4.3% yield |
The economists in Europe are no better than economists in America. European economists have been using their 1980s macroeconomic models to predict that Europe would return to rapid growth and would wipe out any debt. But there’s been no V-shaped recovery in Europe, either. Two-year bond yields (interest rates) for Italy and Spain continue to increase, while those for Greece are still well above 30%.
Big Peace

